The typical marketing dashboard enables data to be thrown onto a screen. I chose “thrown” deliberately. It may look appealing, but the viewer can be easily misled. They can feel as though they are wading through a mess of data.
Your Data isn’t clean Sir..
The dirt can be well hidden. But destructive. This makes it hard for the reader to understand the story you want to tell.
To explain…
Many dashboards emphasize their ability to include data from online sources. This source data is simply fed through to the dashboard.
Sadly this simple flow creates the problem. The data in the typical online system has many problems. These include:
There are bits of data that should be filtered from your dashboard. Possibly from development or other test scenarios.
Encoded names are like jargon. The names can include countries and other identifiers. These have meaning to those that manage the online system. But the marketing dashboard viewer may be a business executive. This executive doesn’t know or care about the internals of some online system. So the jargon can make viewers reject the dashboard.
Splintered items due to case mismatch. These “duplicated items make reports useless Aggregation would make the reports readable.
Your dashboard charts don’t help readers with their real problem
Data gathering normally captures as much easy data as possible. The marketing dashboard can then show this presented at will. For example Google Analytics can easily capture every page on a website. The data gathering may be deep as well. It may capture lots of detail. This allows the reader to segment the data.
For instance. Google Analytics events are often labelled with the page. This means the reader knows on which page a particular event type occurred. There can be thousands of different pages on which even a single event type occurs. Let’s suppose each time a web visitor downloads a brochure for a kettle an event is counted. And suppose our dashboard user looks after household electrical products.
It still requires much work to make the numbers useful to our dashboard user. 1) We should be able to add kettles to all the other household electrical brochure downloads. 2) But we should also be able to see the kettle downloads on their own. 2) We should be able to exclude countries that the dashboard user isn’t responsible for.
But segmentation by page doesn’t aggregate products. And aggregating all products could include non electrical product downloads. Geographical segmentation of viewers doesn’t precisely match responsibility for marketing in Southern Europe. The former is about the location of the potential consumer. The latter is about the location of the vendor. With easy global distribution of products we cannot assume these two are the same. So our dashboard user has several nasty choices. None really address the precise problem the reader has.
The more we leave the user to do, the less likely it is that the dashboard will help answer their real questions. We relegate the dashboard to “interesting.. but not crucial”.
Your Data hasn’t been polished prior to display on the dashboard.
The example above shows how much we have to manipulate data to make it crucial information for the user.
Bad compromises result when the data doesn’t match what the user needs.
A dashboard can allow the user to segment and manipulate data. Yet this forces the senior manager to become an analyst.
I believe this is an abdication of responsibility on the part of the dashboard provider. Is the dashboard vendor just hoping that the consumer won’t notice?
Your dashboard doesn’t give adequate context
Dashboards often show data on a continuing trend. The dashboard user may compare this month with last month visually. But the data has other relevant contexts. There may, we hope, have been a plan. So the dashboard should allow the user to compare the actual result against the plan. But can every user see if it’s too far away from plan? Think about the plane flying from London to New York. It will be off course for most of it’s journey. But the auto pilot will make sure the error is minimal. It would be a disaster if the plane ran out of fuel off the Brazilian coast.
Your dashboard doesn’t show comparators or tolerances
Any competent engineer understands the concept of tolerances. For instance diameter of each piston within a combustion engine has a tolerance. Each piston will be slightly different. But no piston can be so different it doesn’t fit into the cylinder.
It’s the same for marketing dashboards. There ought to be a tolerable deviation from plan. This enfranchises the non expert dashboard user. As a side note, the discussion of deviation is tolerable helps improve the plan. The qualitative what is good vs bad. What is better or poorer may be hard to assess.
Your dashboard assumes the user can accurately assess trend
Whilst most users have good eyesight this isn’t a good assumption. Changes in longer term trends can be difficult to see. Short term fluctuations may hide any acceleration or deceleration.
It’s like assuming that people know whether an approaching car is speeding up or slowing down. In this case the viewing angle makes a huge difference.
So the data often needs to be smoothed for the dashboard user. And manipulated. These can reveal subtle but important changes. These changes may be important indicators of environmental changes. The effectiveness of marketing locations may be changing. Early warning of these is really helpful.
Your dashboard for marketing doesn’t relate to external objectives.
The client business has objectives. The marketing campaigns are subordinate to these. If the business executive can see a “line of sight” from a chart to a current business objective it’s much more relevant.
And if the link isn’t obvious the dashboard should state the link.
The client business has objectives. The marketing campaigns are subordinate to these. Can the business executive see how a chart relates to a current business goal? If it’s obvious the chart is much more relevant. And if the link isn’t obvious the dashboard should explain the link.
Making sure your agency reporting contains compelling stories that engage your client, and build relationships is vital. It’ll help you upsell the next project. The following ideas are designed to help you do this.
1) Map the reporting onto the clients organisation.
Any global corporate has a complex structure. There are many regions, and product or service groups. Some of these will have come from past mergers and acquisitions.
So the individuals within the corporate have very different responsibilities and perspectives. And the reporting should reflect that.
Matching reports to responsibilities
Readers ignore reports that don’t help them deal with their own responsibilities. The challenge for an agency is to provide reports that every reader values highly.
Restricting the reporting to a small number of individuals is the wrong answer here. It deprives your agency of one of the most powerful marketing and sales aids it has (see below).
Each report should help specific roles within the corporate. It should answer their particular questions. This is far from simple. It is hard to discover all the people and roles who should consume information from reports. These roles should not just lie in marketing. They should extend into sales, support, finance and elsewhere.
This role identification then permits the design of meaningful reports. These reports should answer the key questions that confront each role.
You will guess the total programme here isn’t trivial or short. It is likely to stretch over months. Benefits will grow as the reporting gets more advanced and serves more roles.
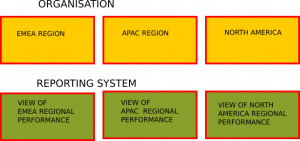
This programme can transform the relationship between agency and client. It has the potential to improve the quality of decision making across the corporate. Why not configure the Google Analytics views so reports match the organisational structure?
A trivial example would be to configure the views within Google Analytics as follows.
The modern global corporate has a complex structure. And will have many product groups. This structure forms the basis of the roles – and the formal hierarchy. The websites will recognise this structure, even if poorly. So there are opportunities to customise the analytics package, creating custom reports.
But beyond this example lies huge opportunity. One can customise Google Analytics to reflect opportunities that your client’s business faces.
2) Simulate to improve the quality and mitigate the risks of reporting failure.
Agencies often recommend a new website or radical changes to the existing site. Perhaps the data gathering isn’t working well and requires radical change.
Testing the data gathering before go live dramatically reduces the risks. Marketing often push for Go Live to hit a seasonal opportunity and time campaigns to suit. If the reporting on a shopping cart fails then the business could be flying blind for a period. The business would be unable to judge what’s working or what’s failing. Simple errors in the data gathering and measurement infrastructure can lead to this. So tests before the crucial period can be invaluable.
There’s no reason to avoid testing the measurement infrastructure. The usability and facilities of the website would be before “go live”. But we need to simulate visitors because it isn’t economic to do this with human (live) visitors.
But beyond the risk of technical failure lie even more important considerations.
Dealing with the political risk
The proponent of radical change takes a considerable political risk. Particularly when it involves the data collection and analytics for a big corporate.
The customer inside the corporate must weigh the personal risk to their career. Often they will feel the risks to reputation or prospects are just too high. Many people within the corporate may have quietly accepted the existing situation. Many will accept the “reporting just doesn’t help”. These people may want a quiet life and want to avoid any change. Whilst others who like the current analytics setup could be seriously upset.
The roles adopted are like that of the prophet and an unwilling prospective follower. “If only the follower would accept the prophets’ message”. If they did this “the world would become a happier place”. But the cautious “follower” is torn between the sales message and fear. What if it all goes wrong? Fear of adverse consequences in a corporate scenario is a powerful motivator.
Simulation is the answer.
The best answer to help everyone is a well developed simulation. We use a “robot army” of visitors to prove in the safe “sandbox” that the proposed reporting system works. The simulation can prove the case for change at minimal risk. Adjustments can be made to deal with challenges or objections. The simulation doesn’t affect the live infrastructure or reporting regime.
The sceptical client can see that the change works for them and any stakeholders. And the client also can judge that the reporting improvements are worth any disruption. Any disruption can be explored and steps put in place to mitigate this.
3) Create reports that use the full richness of the web, not just a virtual billboard
Dramatic advances in technology haven’t really affected the common online “dashboard”. It’s still stuck in a timewarp. It often shows:
Graphics only.
A single set of pictures to all consumers.
There is no way for consumers to comment or otherwise engage with the “broadcaster”.
This is a bit weird . There isn’t any audio, or video, and even text is rare. This strangles rich online communication amongst agency experts and client staff at birth.
The sticking plaster is the regular client meeting. Now this certainly allows the client to provide all sorts of feedback. But this has serious disadvantages.
Explaining what is being shown takes time.
Those who can’t make the meeting can’t hear the explanation or contribute.
Follow up doesn’t happen “in context”. It typically relies on email. Follow up can get lost amongst a mass of other messages. The link between the follow up and the original information on the reports is weak. And those who aren’t included on the email don’t see it.
Now there are some conspiratorial reasons for restricting the reporting to this limited set of features – but that’s covered in my book (see elsewhere for details)….
4) Use a distribution system to build and enhance relationships
The typical agency and client relationship relies on a small number contacts. Your agency will prosper if many client personnel want to engage with your agency. You can stimulate this urge.
Many corporate staff have little or no information to help predict forward workload. The marketing agency has information that could make a serious difference here. By providing this you can shatter perceptions about the value of marketing. This would help both the agency and its marketing contacts.
The value of marketing that only sees its responsibility as gaining leads is much less to a client.
But if marketing tries to improve the entire customer journey. If a marketing agency works to increase client revenue and profit. If the agency works to provide real value to the client; the scope is huge.
Marketing often facilities the website(s), customer communication and support systems. Post sale support staff could use data about usage of these systems. These aren’t the traditional contents of a marketing report pack. But they can be really valuable.
5) Weaponise reporting to differentiate your agency and repel potential competitors
The Business Marketing Club’s B2B Barometer 2018 survey was interesting. 67% of the larger B2B agencies wanted to improve the marketing of their agency.
Reporting is normally a contractual obligation. The agency has to do it. But why should your agency accept a tickbox approach? Why adopt a hurdle criterion of just “making sure the reporting is adequate”? Should your agency limit its ambition in that way? What about considering how reporting provides a means to differentiate your agency.
Your agency could expand the scope of its reporting for mutual benefit.
Your agency could expand the type of reporting. It could provide more expert insight and build closer relationships.
This could frustrate anyone suggesting your agency is like all the others.
There are 7 marketing mistakes agencies make when reporting to corporate clients. Many of these mistakes are accidental. But accidental marketing mistakes can still hurt both your agency and the client.
1. Separating analytics from technical skills.
Many people see analytics as a separate skill from web development. Analytics may bore the brilliant web developer. The developer might be no good at analytics. And the analyst might be no good as a programmer.
Web technologies and programming knowledge stills matters for the analytics expert. Why? The analyst is using data gathering that requires web technologies. It’s a marketing mistake to try and separate them. And it’s not just the web technologies you might expect.
Your analyst should understand the crucial role of the web scripting languages. As scripts help produce the HTML output. The scripts can include loops. And loops can produce duplicates on the same page. These duplicates destroy the uniqueness a naive analyst might be relying on.
Client side script (Javascript) is crucial to data collection. The Google Analytics snippet uses Javascript to gather lots of information from the browser environment. The snippet then sends an image request to https://www.google-analytics.com/r/collect. If the Javascript click handlers don’t work data collection can fail.
Understanding a browser page load network traffic is invaluable. So the analytics can diagnose stubborn measurement errors. The analytics expert who can work with these is much more capable.
Other web technologies also affect the data gathering. Cascading Style Sheets (CSS) are used by Google Tag Manager. As CSS allows people to retrofit data collection to existing web pages.
Google Tag Manager works well, but development expertise is still needed. For example a single page application breaks web analytics assumptions. It uses a single page address (seen in the browser address bar) for many steps. This makes it hard for the analyst to know where step 1 ends, and step 2 starts. Developers often need to install extra code to sort this out.
2. Making do with limited in house expertise
Is it harder than it should be?
Many marketing professionals understand the concepts of analytics. The marketer may be able to interpret many items as a expert analyst would. For example looking at different channels and bounce rates isn’t hard.
But limited knowledge contributes to marketing mistakes. A deeper appreciation of the principles and technologies underpinning the reports helps. An agency can use this to provide more value to its clients. This will help avoid any client feeling shortchanged.
It’s like the classic 80/20 pareto analysis. The generalist may be able to deal with 80% of the analytics. But 80% of the value may lie in the other 20% and explaining the subtleties.
To pick some examples.
It’s fairly easy to install the eCommerce addins to Google Analytics. And the reports are relatively easy to read. But how does one know whether the numbers are correct?
One has to start with an external system. And the rules around currencies, tax and shipping applied by the business. These may be complex. The outputs may be hard to reconcile.
There may be time zone differences. The Google Analytics account could be in the US Pacific timezone and the external system is in US Central timezone. A specific transaction could appear on different dates in the two systems.
Sometimes the shopping cart makes the goal funnel configuration hard.
For instance shopping carts may append parameters to the pages. These parameters can require regular expressions to sort things out. But sorting can be hard with the awkward syntax of regular expressions.
Another example. The analytics may appear to be working correctly. But there may be intermittent failures in the reports. It takes more expertise to identify this and sort it out.
Wise agencies may seek “top up expertise”. This helps where the numbers of complex queries don’t justify an extra member of staff. The result can significantly improve the quality and value delivered to the client.
3. Limping on with a broken infrastructure
Your agency may dream of winning that new big client. Can you leave the can be worms alone? To do so can be one of the biggest marketing mistakes.
Many big corporates have a history of mergers and acquisitions. Each acquired company has websites and different marketing techniques. The individual “child” sites may be re-skinned and modified. They may “appear to fit” into their new family. This may be the easy bit to achieve.
It can be much harder to mesh the reporting for all the websites. For instance each may have a separate google analytics account. Achieving a comprehensive overview is hard with a fragmented approach.
One can put a single “rollup” Google Analytics snippet on each website. This might replace or go alongside the existing snippet. Rollup accounts have all the reporting in one location. But without careful configuration the home page visitor numbers will be wrong. The home page visitors to every site would simply be added together. An option is to insert the hostname as a prefix to the URL in Google Analytics. This stops misleading the reader with inflated numbers.
But a “rollup” snippet can still have vast numbers of pages. As we now have the traffic from all the original accounts in one new account. This could lead to sampling problems and other nasty side effects. The naming conventions for some of the customisations are likely to conflict.
The best solution is for an expert to design the reporting solution. This can bring all the individual children together into a coherent structure. Even then it won’t be easy. The solution may be awkward to implement.
These problems don’t only afflict big corporates. Sometimes small growing companies can have a can of worms. These come from their “early years”. The growing business may have IT systems that can’t support the greater scale.
The system may not fail completely. Instead the surrounding processes provide evidence of a “hand to mouth” existence. At this point many interrelated issues will affect the growing business. These can have serious implications for your agency.
Processes and practices may need reform to become more robust and support growth.
Systems and code that relied on these processes and practices will need auditing. Bringing them to an acceptable baseline may be hard.
Sometimes people will want to start again. However serious marketing mistakes arise if evidence isn’t gathered. Swapping inconclusive anecdotes doesn’t help good decision making. A well founded decision for a fresh start or a fix is required.
It may be a hard slog to sort out the mess. But leaving it can poison the whole client relationship.
4. Trying to use Google Tag Manager (GTM) to avoid any development involvement.
Google Tag Manager can really useful. The business advantage of releasing marketing from the development road map and test cycles is obvious. But marketing mistakes occur if people assume it breaks the link completely.
Google Tag Manager and Analytics rely on the full page being loaded. So any loading problem can stop them working entirely.
Will it all fall down?
Google Tag Manager uses website code to collect data. So if the browser fails to run all of the code on a page, data collection can fail.
Most current browsers have a number of “threads”. Each thread interprets javascript code. If a thread crashes – then some code simply isn’t reached. So any data collection that “follows” the crash fails.
Something called “Event Bubbling” can also interfere with a Tag Manager like GTM. This is because they listen to events which “bubble up” to the topmost element. If “event bubbling” is stopped early the event of interest doesn’t reach the tag manager.
So there is one simple non technical message to take away. Tag Managers aren’t foolproof. And because they rely on code, they can be broken by code.
Differing objectives
The mismatch of objectives between web developer and analyst can cause problems with GTM.
A web developer uses CSS to control the look and feel of the elements. To achieve similar appearance everywhere. For instance all buttons should look and behave in the same way.
The analyst has a very different objective. The analyst wants to know if button A has been clicked. And not confuse this with clicks on button B. This difference of objectives means that the CSS designed for uniformity may be almost useless for the analyst using Google Tag Manager.
So a big marketing mistake is to stop any development activity.
5. Trying to avoid process changes that would enable smart data gathering
Why not confront the truth?
Smart data gathering doesn’t just happen. Sometimes we must invent it. I learnt to appreciate this in my early career as a mechanical engineer.
I had to work out quality assurance criteria for Ford Motor Company. We had to ensure assembled car suspension arms didn’t fall apart.
These arms were fitted onto Ford cars. A tape measure was useless for determining whether the arm would remain intact. We needed to find an appropriate technique. We decided to monitor the forces used during assembly at particular points.
The challenges with collecting data from online systems are different. We need the same kind of creative thinking to avoid marketing mistakes.
So the approach I would recommend is:
Identify the processes for which to count success and failures, or assess progress steps.
Identify each step in the process.
Create a means of identifying beyond doubt which step we’ve reached.
Decide how to evaluate whether each step succeeded or failed.
Design and implement measurements for each step. The data collection must prove the failure or success of each step.
This means your analytics no longer is restricted to the standard configuration that “came out of the box”. The standard package can’t cater for all the unique challenges that your agency’s client has. We must design, implement and test data gathering techniques to fit a specific client.
Our aim is to create a “world of measurement” that supports the client’s business. This may require development support. Their help in constructing Cascading Style Sheets and code will determine whether Google Tag Manager is viable.
In many cases these techniques may not be difficult. Perhaps we need to count button clicks, or assess particular form entries.
However the techniques may have implications for the rest of the process. The speed with which the website moves a user between pages might stop the data collection. In these cases review the process design.
6 Not recognising when a report “doesn’t work”.
The standard reports that “come in the box” with Google Analytics are certainly comprehensive. But marketing mistakes arise if it’s assumed they provide answers to all the questions the client has; or all of them are relevant.
If it doesn’t work, why pretend?
It’s worth reflecting for a moment how assumptions would change if we didn’t have free or near free cloud based services.
Back some 20 years ago, the comprehensive package like Google Analytics would have sold for many thousands of pounds.
And the vendor wouldn’t just offer software package. It would have pushed hard to sell consulting services.
These consultancy services customised the package to suit the customer’s business. Google cross subsidises the software supply from digital advertising.
But it’s a bad marketing mistake to let customisation just disappear. The lack of a vendor with a commercial reason to sell customisation misleads people. Naively they can think customisation isn’t required.
But a mass market standard offering like Google Analytics cannot cater for a customer’s key business processes. And proper customisation takes time and effort.
Some of the customisation will push valuable information into otherwise empty standard reports. So for instance there are no goal funnels until goals are configured. Using this stepwise process definition means the “goal funnel” report can provide a lot of value. Value that makes Google Analytics reflect the nuances of an unique business.
Other marketing mistakes occur when too many dimensions are shown in one report, or the wrong dimension is chosen as the primary index.
For instance I’ve seen attempts to show the various channels that web traffic uses. A mini bar chart shows the varying number of sessions for desktop vs mobile vs tablet device for each marketing channel.
Does this work? No. The numbers of sessions per channel can vary dramatically. The number of sessions 100% is far from consistent. It would be clearer to show the popularity of each channel is by device type.
Recognising how the web visitor thinks clarifies this.
A visitor doesn’t choose the marketing channel to which they wish to respond. And choose a device afterwards.
A visitor selects a device first. And only afterwards reads information on it.
So the likelihood that a user responds to a marketing channel on a particular device is clearer.
7. Failing to implement proper naming conventions
More marketing mistakes occur with poor naming. Naming is surprisingly important. There are two important criteria:
The names within reporting need to be easily understood. These might be for events, goals, concepts, stages or processes.
Naming needs to show the user how to navigate the hierarchy. This is vital if users are searching for the answer to a question and are trying to locate information to help them.
Is it hard to understand?
In most cases the naming should reflect the client’s business.
There are probably subtleties about the way a particular term is understood by a particular client.
For instance marketing qualified lead carries with it a set of assumptions about what it took for the prospect to be “qualified”.
There should be a glossary of terms so newcomers can rapidly learn any new terminology.
Stakeholders may well have come from competitors who use the terms in a subtly different way. Or from other areas within the same business that don’t share the same assumptions.
Getting naming conventions implemented is normally more about process than difficulty. However we must accept that perfection and complete coherency is unattainable. We are simply looking for a set of names that fulfill the two criteria above.
Conversations about naming conventions need to cover:
how it can robust and accept future names without destroying the fundamental logic.
how it communicates any subtleties arising from the data gathering or processing
I hope this post about Marketing Mistakes in reporting is useful. I realise it’s long and involved. Please get in touch or comment below if you want.
This website uses cookies to improve your experience. We'll assume you're ok with this, but you can opt-out if you wish. Cookie settingsACCEPT
Privacy & Cookies Policy
Privacy Overview
This website uses cookies to improve your experience while you navigate through the website. Out of these cookies, the cookies that are categorized as necessary are stored on your browser as they are essential for the working of basic functionalities of the website. We also use third-party cookies that help us analyze and understand how you use this website. These cookies will be stored in your browser only with your consent. You also have the option to opt-out of these cookies. But opting out of some of these cookies may have an effect on your browsing experience.
Necessary cookies are absolutely essential for the website to function properly. This category only includes cookies that ensures basic functionalities and security features of the website. These cookies do not store any personal information.
Any cookies that may not be particularly necessary for the website to function and is used specifically to collect user personal data via analytics, ads, other embedded contents are termed as non-necessary cookies. It is mandatory to procure user consent prior to running these cookies on your website.


 Dramatic advances in technology haven’t really affected the common online “dashboard”. It’s still stuck in a timewarp. It often shows: